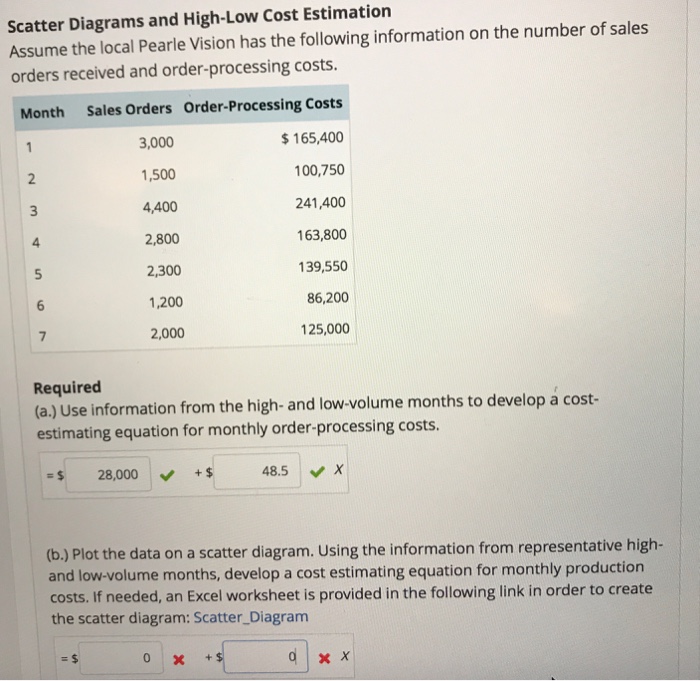
Scatter Diagrams and High-Low Cost Estimation Assume the local Pearle Vision has the following information on the number of sales orders received and order-processing costs Month Sales Orders Order-Processing Costs $165,400 100,750 241,400 163,800 139,550 86,200 125,000 3,000 1,500 4,400 2,800 2,300 1,200 2,000 4 Required (a.) Use information from the high- and low-volume months to develop a cost- estimating equation for monthly order-processing costs. -$ 28,000+ 48.5 X (b.) Plot the data on a scatter diagram. Using the information from representative high- and low-volume months, develop a cost estimating equation for monthly production costs. If needed, an Excel worksheet is provided in the following link in order to create the scatter diagram: Scatter_Diagram
Expert Answer
- High low volume cost estimating equation
High volume in month 3=no. of sales orders=4400
Cost=$241,400
Low volume month6=no. of sales orders=1200
Cost=$86,200
Equation:
Y=a+bX
Y=cost
X=Volume=No. of sales order
Y1=$86,200 , X1=1200
Y2=$241,400 X2=4400
b=(Y2-Y1)/(X2-X1)=(241400-86200)/(4400-1200)=$48.5
Estimated Variable cost per sales order=$48.5
a=Y1-bX1=86200-48.5*1200=$28,000
Estimated fixed cost=$28,000
Cost Estimating Equation:
Order processing cost(Y)=$28,000+48.5X
| Y= | $28,000 | + | $48.50 | X |
| X | Yac | Ye=28000+48.5*X | |
| Month | Number of orders | Actual order processing cost | Estimated order processing cost |
| 1 | 3000 | 165400 | 173500 |
| 2 | 1500 | 100750 | 100750 |
| 3 | 4400 | 241400 | 241400 |
| 4 | 2800 | 163800 | 163800 |
| 5 | 2300 | 139550 | 139550 |
| 6 | 1200 | 86200 | 86200 |
| 7 | 2000 | 125000 | 125000 |


